EXHIBIT 99.2
Published on March 14, 2022
Exhibit 99.2

©Copyright 2022 Evolv Technologies, Inc. All Rights Reserved. Q4 2021 Earnings Call March 14, 2022
©Copyright 2022 Evolv Technologies, Inc. All Rights Reserved. Safe Harbor Statement & Use of Non - GAAP Measures 2 Certain statements in this press release may constitute “forward - looking” statements and information, within the meaning of Sect ion 27A of the Securities Act of 1933, Section 21E of the Securities Exchange Act of 1934, and the safe harbor provisions of the U.S. Private Securities Litigation Reform Act of 1995 that relate to our c urr ent expectations and views of future events. Forward - looking statements involve the Company’s current expectations and projections relating to its financial condition, customer acquisition efforts, competi tiv e position, future financial results, plans, objectives, and business. All statements other than statements of historical facts contained in this press release are forward - looking statements. In some cases, these f orward - looking statements can be identified by words or phrases such as “may,” “will,” “expect,” “should,” “could,” “anticipate,” “aim,” “estimate,” “intend,” “plan,” “believe,” “potential,” “conti nue ,” “is/are likely to” or the negative of these terms or other similar expressions. These forward - looking statements are subject to risks, uncertainties and assumptions, some of which are beyond our control. In additio n, these forward - looking statements reflect the Company’s current views with respect to future events and the Company’s performance and are not a guarantee of future performance. Actual outcomes may dif fer materially from the information contained in the forward - looking statements as a result of a number of factors, including, without limitation expectations regarding the Company’s strategies and future financial performance, including its future business plans or objectives, prospective performance and opportunities and competitors, revenues, products and services, pricing, operating expenses, mark et trends, liquidity, cash flows and uses of cash, capital expenditures; the Company’s history of losses and lack of profitability; the Company’s reliance on third party contract manufacturing; the rate of innovation required to maintain competitiveness in the markets in which the Company competes; the competitiveness of the market in which the Company competes; the ability for the Company to obtain, mai nta in, protect and enforce the Company’s intellectual property rights; the concentration of the Company’s revenues on a single solution; the Company’s ability to timely design, produce and launch its sol utions, the Company’s ability to invest in growth initiatives and pursue acquisition opportunities; the limited liquidity and trading of the Company’s securities; geopolitical risk and changes in ap pli cable laws or regulations; the possibility that the Company may be adversely affected by other economic, business, and/or competitive factors; operational risk; risk that the COVID - 19 pandemic, including v ariants, vaccine roll - out efforts, and local, state, and federal responses to addressing the pandemic may have an adverse effect on the Company’s business operations, as well as the Company’s financial c ond ition and results of operations; litigation and regulatory enforcement risks, including the diversion of management time and attention and the additional costs and demands on resources; and the r isk factors set forth under the caption “Risk Factors” in our prospectus, filed with the Securities and Exchange Commission (the “SEC”) on September 3, 2021, and in our other documents filed with or furnis hed to the SEC. These statements reflect management’s current expectations regarding future events and operating performance and speak only as of the date of this press release. You shoul d n ot put undue reliance on any forward - looking statements. Although we believe that the expectations reflected in the forward - looking statements are reasonable, we cannot guarantee that future result s, levels of activity, performance and events and circumstances reflected in the forward - looking statements will be achieved or will occur. Except as required by law, we undertake no obligation to update or re vise publicly any forward - looking statements, whether as a result of new information, future events or otherwise, after the date on which the statements are made or to reflect the occurrence of unan tic ipated events. In this presentation, the Company’s adjusted gross profit, adjusted gross margin, and adjusted EBITDA are not presented in ac cor dance with generally accepted accounting principles (GAAP) and are not intended to be used in lieu of GAAP presentations of results of operations. Adjusted gross profit and adjusted gross margin e xcl ude one - time items and depreciation and amortization which management believes provides a more meaningful representation of contribution margin. Adjusted EBITDA is defined as net income (loss) pl us depreciation and amortization, share - based compensation and other expense. Management presents non - GAAP financial measures because it considers them to be important supplemental measures of perf ormance. Management uses non - GAAP financial measures for planning purposes, including analysis of the Company's performance against prior periods, the preparation of operating budget s a nd to determine appropriate levels of operating and capital investments. Management also believes this non - GAAP financial measures provide additional insight for analysts and investors in evaluating th e Company's financial and operational performance. However, non - GAAP financial measures have limitations as an analytical tool and are not intended to be an alternative to financial measures pre par ed in accordance with GAAP. We intend to provide non - GAAP financial measures as part of our future earnings discussions and, therefore, the inclusion of non - GAAP financial measures will provide co nsistency in our financial reporting. Investors are encouraged to review the reconciliation of these non - GAAP measures to their most directly comparable GAAP financial measures. A reconciliation of our non - GAAP financial measures to their most directly comparable GAAP measures has been provided herein.

©Copyright 2022 Evolv Technologies, Inc. All Rights Reserved. Peter George Chief Executive Officer

©Copyright 2021 Evolv Technologies, Inc. All Rights Reserved. Our Vision A safer world for people to work, learn and play.

©Copyright 2021 Evolv Technologies, Inc. All Rights Reserved. Safe Healthy Contactless Personal Frictionless Informed Trends Driving Our Market
©Copyright 2022 Evolv Technologies, Inc. All Rights Reserved. ©Copyright 2022 Evolv Technologies, Inc. All Rights Reserved. The Imperative Today • We believe the pandemic has changed the way we live, work and play • We believe people have an elevated sense of anxiety about gathering again • Gun violence is at a historic high • Our customers are relying on Evolv to help make their venues safe • We’re seeing companies make the architectural shift from analog to digital and we believe Evolv is leading the Digital Transformation of physical security • Evolv has developed the first and only AI - based Weapons Detection Platform that prevents threats from going into places they shouldn’t but preserves the visitor experience as people walk right in “at the pace of life” • Our platform is delivered as a “Security as a Service” with 4 - year subscription terms in vertical markets where little to no advanced technology is present today • We believe Evolv is well - positioned to “ democratize ” security Evolv: The Human Security Company Safer Everywhere
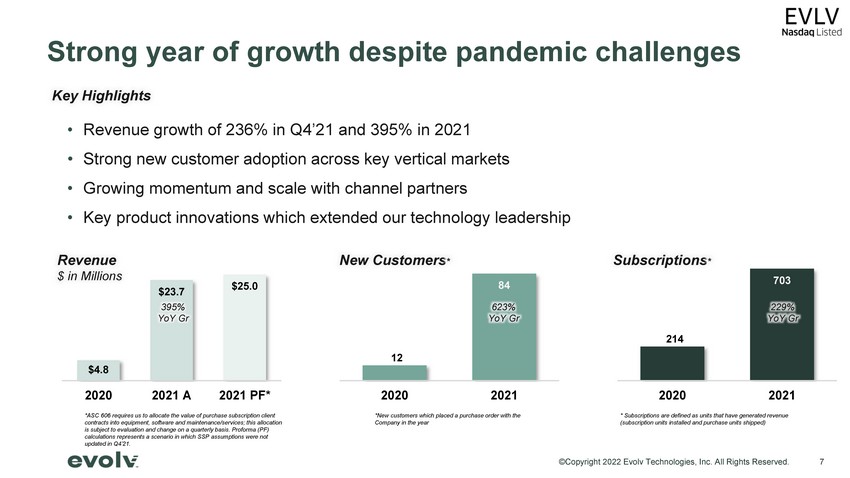
©Copyright 2022 Evolv Technologies, Inc. All Rights Reserved. Strong year of growth despite pandemic challenges • Revenue growth of 236% in Q4’21 and 395% in 2021 • Strong new customer adoption across key vertical markets • Growing momentum and scale with channel partners • Key product innovations which extended our technology leadership 7 $4.8 $23.7 $25.0 2020 2021 A 2021 PF* Revenue $ in Millions 395% YoY Gr 12 84 2020 2021 New Customers * 623% YoY Gr Key Highlights 214 703 2020 2021 Subscriptions * 229% YoY Gr * Subscriptions are defined as units that have generated revenue (subscription units installed and purchase units shipped) *ASC 606 requires us to allocate the value of purchase subscription client contracts into equipment, software and maintenance/services; this allocation is subject to evaluation and change on a quarterly basis. Proforma (PF) calculations represents a scenario in which SSP assumptions were not updated in Q4’21. *New customers which placed a purchase order with the Company in the year
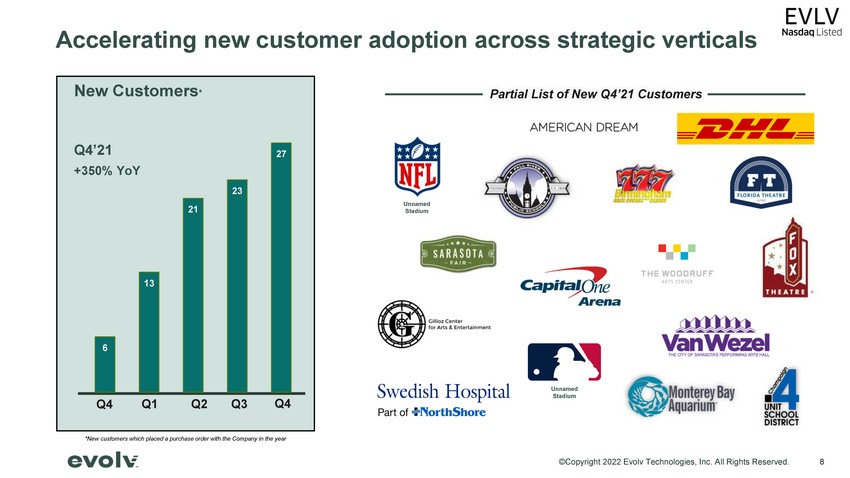
©Copyright 2022 Evolv Technologies, Inc. All Rights Reserved. 6 13 21 23 27 Q1 Q2 Q3 Q4 Accelerating new customer adoption across strategic verticals Q4 New Customers * Q4’21 +350% YoY *New customers which placed a purchase order with the Company in the year Partial List of New Q4’21 Customers Unnamed Stadium Unnamed Stadium 8
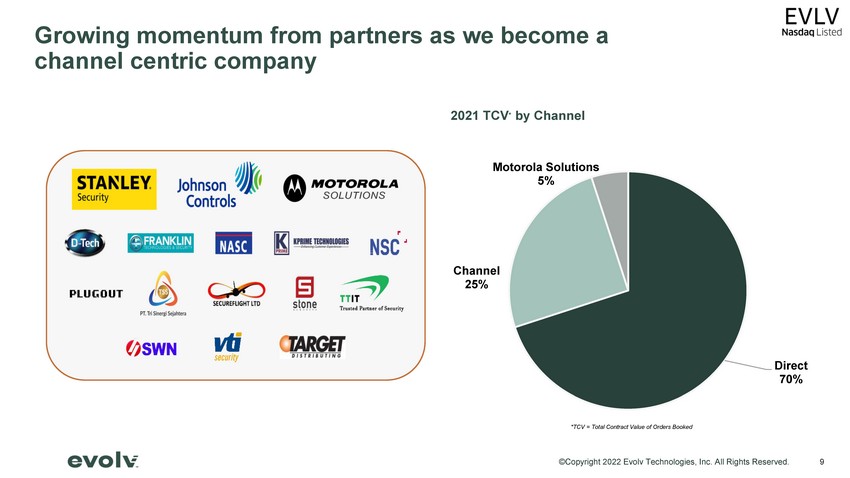
©Copyright 2022 Evolv Technologies, Inc. All Rights Reserved. Growing momentum from partners as we become a channel centric company 2021 TCV * by Channel Direct 70% Channel 25% Motorola Solutions 5% *TCV = Total Contract Value of Orders Booked 9
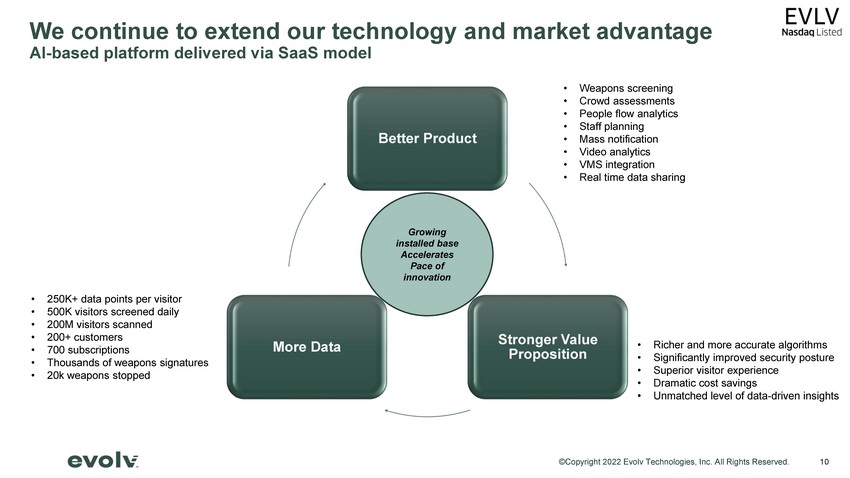
©Copyright 2022 Evolv Technologies, Inc. All Rights Reserved. We continue to extend our technology and market advantage AI - based platform delivered via SaaS model • 250K+ data points per visitor • 500K visitors screened daily • 200M visitors scanned • 200+ customers • 700 subscriptions • Thousands of weapons signatures • 20k weapons stopped Growing installed base Accelerates Pace of innovation 10 Better Product Stronger Value Proposition More Data • Weapons screening • Crowd assessments • People flow analytics • Staff planning • Mass notification • Video analytics • VMS integration • Real time data sharing • Richer and more accurate algorithms • Significantly improved security posture • Superior visitor experience • Dramatic cost savings • Unmatched level of data - driven insights
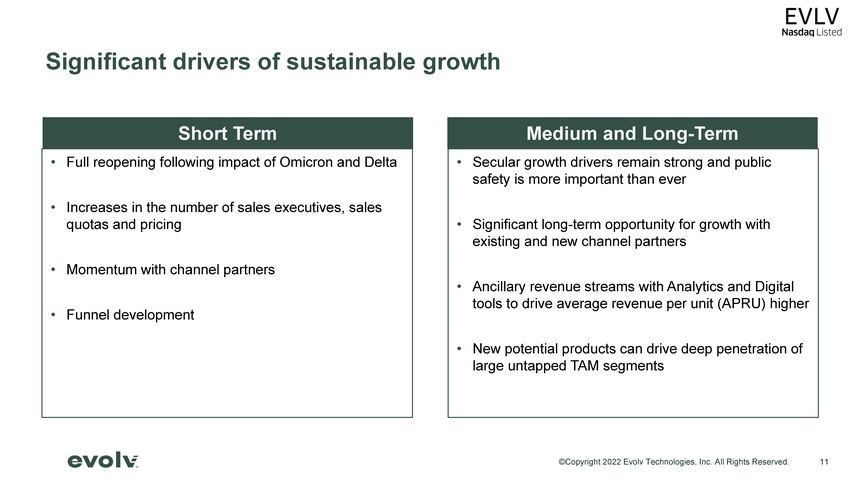
©Copyright 2022 Evolv Technologies, Inc. All Rights Reserved. • Secular growth drivers remain strong and public safety is more important than ever • Significant long - term opportunity for growth with existing and new channel partners • Ancillary revenue streams with Analytics and Digital tools to drive average revenue per unit (APRU) higher • New potential products can drive deep penetration of large untapped TAM segments 11 Significant drivers of sustainable growth Short Term Medium and Long - Term • Full reopening following impact of Omicron and Delta • Increases in the number of sales executives, sales quotas and pricing • Momentum with channel partners • Funnel development

©Copyright 2022 Evolv Technologies, Inc. All Rights Reserved. Mario Ramos Chief Financial Officer & Chief Risk Officer
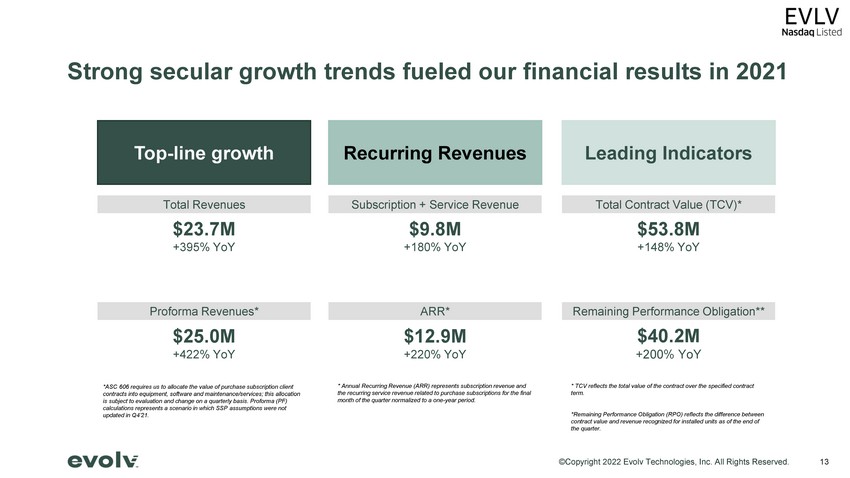
©Copyright 2022 Evolv Technologies, Inc. All Rights Reserved. Strong secular growth trends fueled our financial results in 2021 13 Recurring Revenues Subscription + Service Revenue ARR* $9.8M +180% YoY * Annual Recurring Revenue (ARR) represents subscription revenue and the recurring service revenue related to purchase subscriptions for the final month of the quarter normalized to a one - year period. $12.9M +220% YoY Leading Indicators Total Contract Value (TCV)* $53.8M +148% YoY * TCV reflects the total value of the contract over the specified contract term. *Remaining Performance Obligation (RPO) reflects the difference between contract value and revenue recognized for installed units as of the end of the quarter. Remaining Performance Obligation** $40.2M +200% YoY Top - line growth Total Revenues Proforma Revenues* $23.7M +395% YoY $25.0M +422% YoY *ASC 606 requires us to allocate the value of purchase subscription client contracts into equipment, software and maintenance/services; this allocation is subject to evaluation and change on a quarterly basis. Proforma (PF) calculations represents a scenario in which SSP assumptions were not updated in Q4’21.
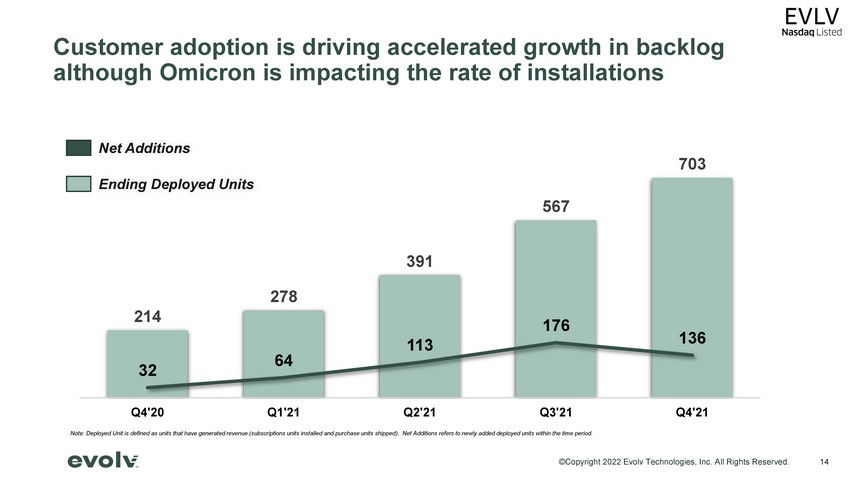
©Copyright 2022 Evolv Technologies, Inc. All Rights Reserved. 214 278 391 567 703 32 64 113 176 136 Q4'20 Q1'21 Q2'21 Q3'21 Q4'21 Customer adoption is driving accelerated growth in backlog although Omicron is impacting the rate of installations Ending Deployed Units Net Additions Note: Deployed Unit is defined as units that have generated revenue (subscriptions units installed and purchase units shipped ). Net Additions refers to newly added deployed units within the time period. 14
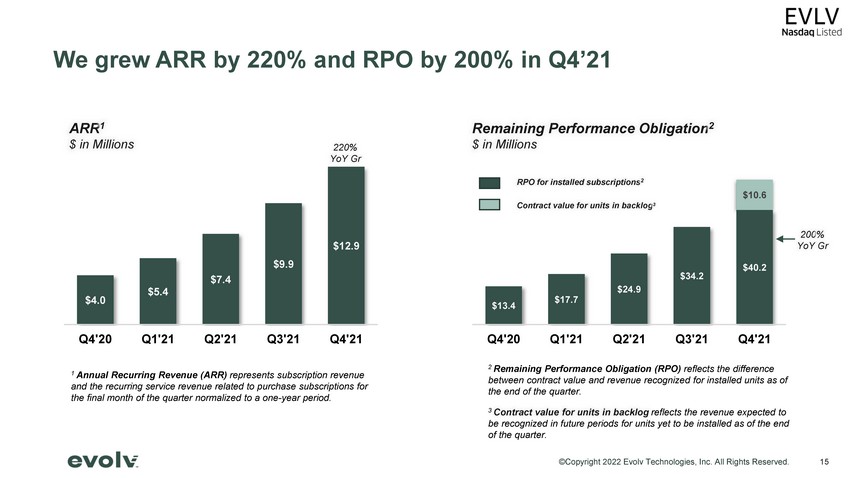
©Copyright 2022 Evolv Technologies, Inc. All Rights Reserved. We grew ARR by 220% and RPO by 200% in Q4’21 Remaining Performance Obligation 2 $ in Millions 2 Remaining Performance Obligation (RPO) reflects the difference between contract value and revenue recognized for installed units as of the end of the quarter. 3 Contract value for units in backlog reflects the revenue expected to be recognized in future periods for units yet to be installed as of the end of the quarter. 15 $13.4 $17.7 $24.9 $34.2 $40.2 $10.6 Q4'20 Q1'21 Q2'21 Q3'21 Q4'21 200 % YoY Gr $4.0 $5.4 $7.4 $9.9 $12.9 Q4'20 Q1'21 Q2'21 Q3'21 Q4'21 ARR 1 $ in Millions 220% YoY Gr 1 Annual Recurring Revenue (ARR) represents subscription revenue and the recurring service revenue related to purchase subscriptions for the final month of the quarter normalized to a one - year period. Contract value for units in backlog 3 RPO for installed subscriptions 2
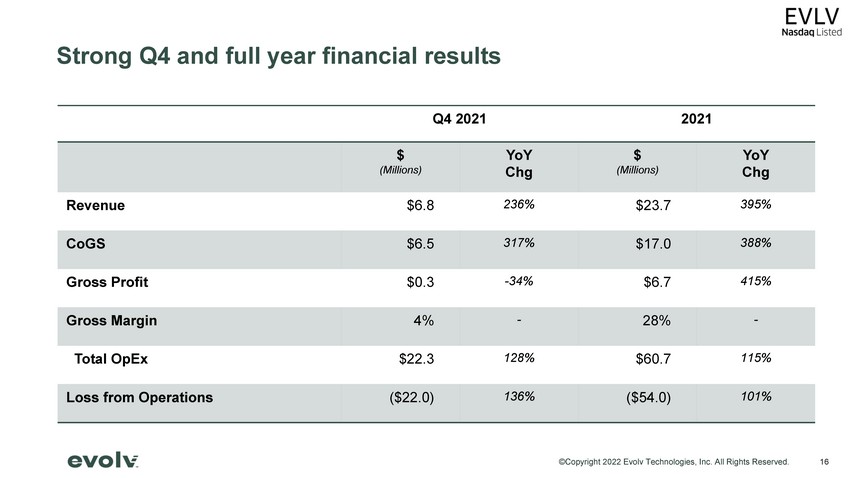
©Copyright 2022 Evolv Technologies, Inc. All Rights Reserved. Strong Q4 and full year financial results Q4 2021 2021 $ (Millions) YoY Chg $ (Millions) YoY Chg Revenue $6.8 236% $23.7 395% CoGS $6.5 317% $17.0 388% Gross Profit $0.3 - 34% $6.7 415% Gross Margin 4% - 28% - Total OpEx $22.3 128% $60.7 115% Loss from Operations ($22.0) 136% ($54.0) 101% 16
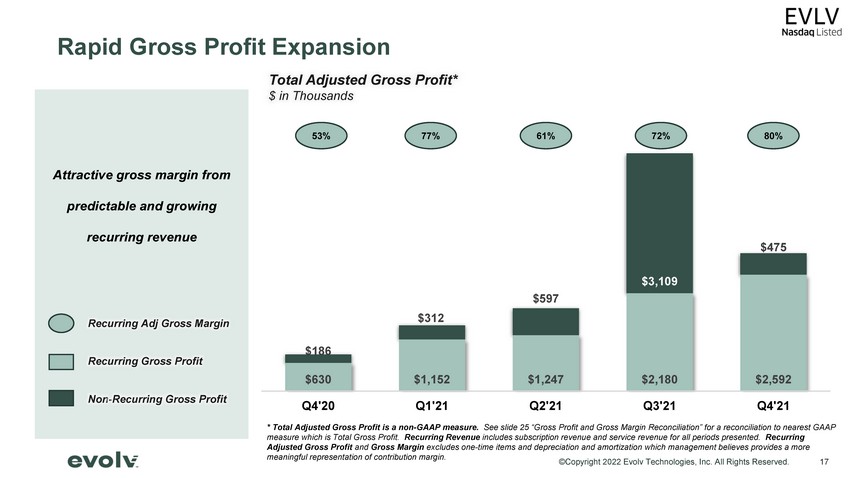
©Copyright 2022 Evolv Technologies, Inc. All Rights Reserved. Attractive gross margin from predictable and growing recurring revenue 17 Rapid Gross Profit Expansion $630 $1,152 $1,247 $2,180 $2,592 $186 $312 $597 $3,109 $475 Q4'20 Q1'21 Q2'21 Q3'21 Q4'21 Total Adjusted Gross Profit* $ in Thousands Non - Recurring Gross Profit Recurring Gross Profit 53% 77% 61% 72% 80% * Total Adjusted Gross Profit is a non - GAAP measure. See slide 25 “Gross Profit and Gross Margin Reconciliation” for a reconciliation to nearest GAAP measure which is Total Gross Profit. Recurring Revenue includes subscription revenue and service revenue for all periods presented. Recurring Adjusted Gross Profit and Gross Margin excludes one - time items and depreciation and amortization which management believes provides a more meaningful representation of contribution margin. Recurring Adj Gross Margin
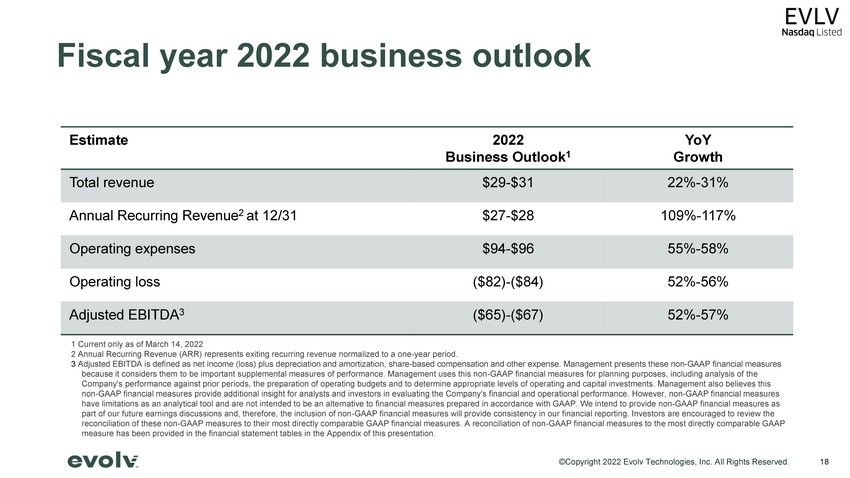
©Copyright 2022 Evolv Technologies, Inc. All Rights Reserved. Fiscal year 2022 business outlook Estimate 2022 Business Outlook 1 YoY Growth Total revenue $29 - $31 22% - 31% Annual Recurring Revenue 2 at 12/31 $27 - $28 109% - 117% Operating expenses $94 - $96 55% - 58% Operating loss ($82) - ($84) 52% - 56% Adjusted EBITDA 3 ($65) - ($67) 52% - 57% 18 1 Current only as of March 14, 2022 2 Annual Recurring Revenue (ARR) represents exiting recurring revenue normalized to a one - year period. 3 Adjusted EBITDA is defined as net income (loss) plus depreciation and amortization, share - based compensation and other expense . Management presents these non - GAAP financial measures because it considers them to be important supplemental measures of performance. Management uses this non - GAAP financial measures for planning purposes, including analysis of the Company's performance against prior periods, the preparation of operating budgets and to determine appropriate levels of oper ati ng and capital investments. Management also believes this non - GAAP financial measures provide additional insight for analysts and investors in evaluating the Company's financial and oper ational performance. However, non - GAAP financial measures have limitations as an analytical tool and are not intended to be an alternative to financial measures prepared in accordance wi th GAAP. We intend to provide n on - GAAP financial measures as part of our future earnings discussions and, therefore, the inclusion of non - GAAP financial measures will provide consistency in our financial reporting. Investors are encouraged to review the reconciliation of these non - GAAP measures to their most directly comparable GAAP financial measures. A reconciliation of non - GAA P financial measures to the most directly comparable GAAP measure has been provided in the financial statement tables in the Appendix of this presentation.
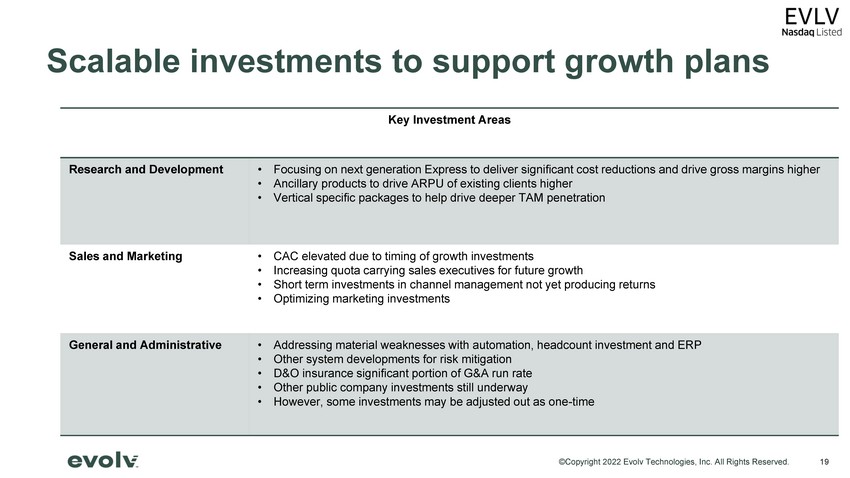
©Copyright 2022 Evolv Technologies, Inc. All Rights Reserved. Scalable investments to support growth plans 19 Key Investment Areas Research and Development • Focusing on next generation Express to deliver significant cost reductions and drive gross margins higher • Ancillary products to drive ARPU of existing clients higher • Vertical specific packages to help drive deeper TAM penetration Sales and Marketing • CAC elevated due to timing of growth investments • Increasing quota carrying sales executives for future growth • Short term investments in channel management not yet producing returns • Optimizing marketing investments General and Administrative • Addressing material weaknesses with automation, headcount investment and ERP • Other system developments for risk mitigation • D&O insurance significant portion of G&A run rate • Other public company investments still underway • However, some investments may be adjusted out as one - time
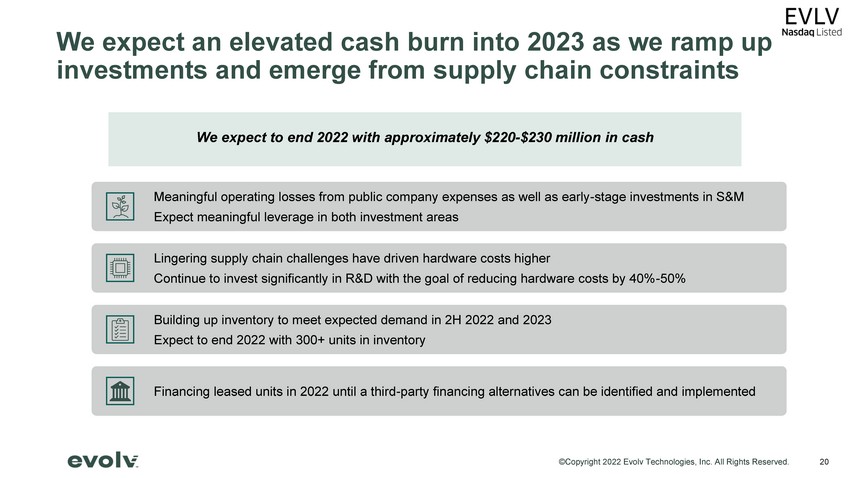
©Copyright 2022 Evolv Technologies, Inc. All Rights Reserved. We expect an elevated cash burn into 2023 as we ramp up investments and emerge from supply chain constraints Meaningful operating losses from public company expenses as well as early - stage investments in S&M Expect meaningful leverage in both investment areas Lingering supply chain challenges have driven hardware costs higher Continue to invest significantly in R&D with the goal of reducing hardware costs by 40% - 50% Building up inventory to meet expected demand in 2H 2022 and 2023 Expect to end 2022 with 300+ units in inventory Financing leased units in 2022 until a third - party financing alternatives can be identified and implemented 20 We expect to end 2022 with approximately $220 - $230 million in cash
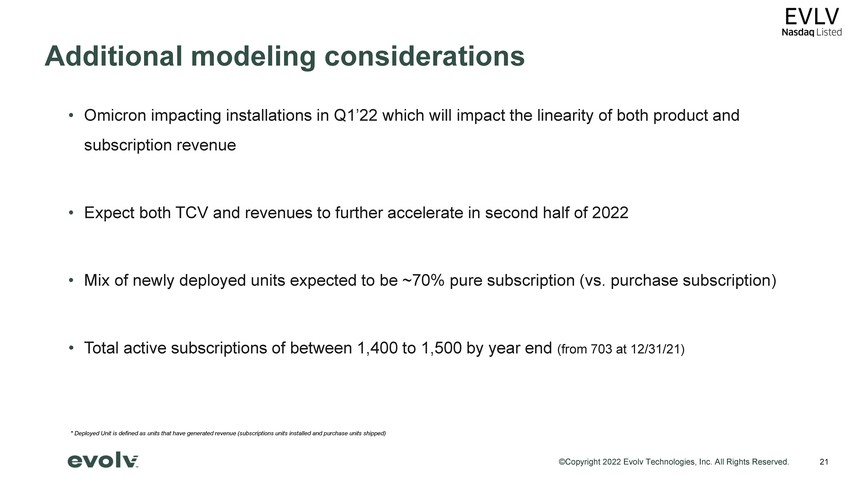
©Copyright 2022 Evolv Technologies, Inc. All Rights Reserved. • Omicron impacting installations in Q1’22 which will impact the linearity of both product and subscription revenue • Expect both TCV and revenues to further accelerate in second half of 2022 • Mix of newly deployed units expected to be ~70% pure subscription (vs. purchase subscription) • Total active subscriptions of between 1,400 to 1,500 by year end (from 703 at 12/31/21) 21 Additional modeling considerations * Deployed Unit is defined as units that have generated revenue (subscriptions units installed and purchase units shipped)

©Copyright 2022 Evolv Technologies, Inc. All Rights Reserved. Q4 2021 Earnings Call Q&A Session

©Copyright 2022 Evolv Technologies, Inc. All Rights Reserved. Appendix
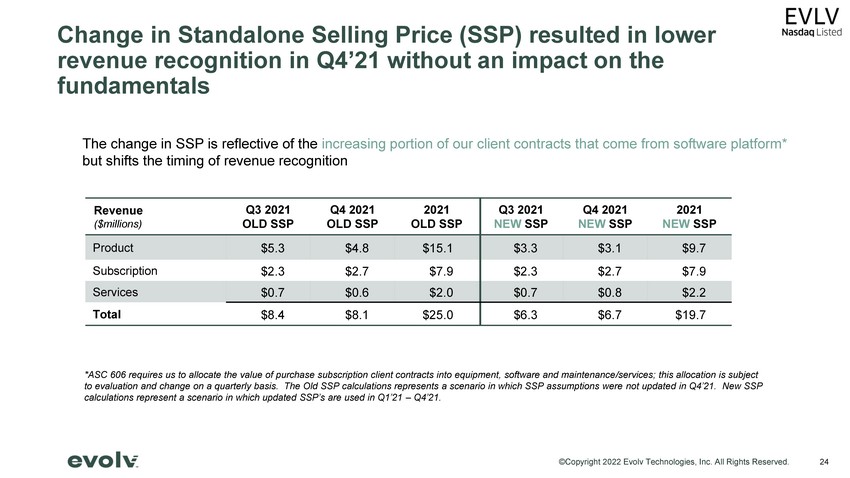
©Copyright 2022 Evolv Technologies, Inc. All Rights Reserved. 24 Change in Standalone Selling Price (SSP) resulted in lower revenue recognition in Q4’21 without an impact on the fundamentals The change in SSP is reflective of the increasing portion of our client contracts that come from software platform* but shifts the timing of revenue recognition *ASC 606 requires us to allocate the value of purchase subscription client contracts into equipment, software and maintenance /se rvices; this allocation is subject to evaluation and change on a quarterly basis. The Old SSP calculations represents a scenario in which SSP assumptions were not updated in Q4’21. New SSP calculations represent a scenario in which updated SSP’s are used in Q1’21 – Q4’21. Revenue ($millions) Q3 2021 OLD SSP Q4 2021 OLD SSP 2021 OLD SSP Q3 2021 NEW SSP Q4 2021 NEW SSP 2021 NEW SSP Product $5.3 $4.8 $15.1 $3.3 $3.1 $9.7 Subscription $2.3 $2.7 $7.9 $2.3 $2.7 $7.9 Services $0.7 $0.6 $2.0 $0.7 $0.8 $2.2 Total $8.4 $8.1 $25.0 $6.3 $6.7 $19.7
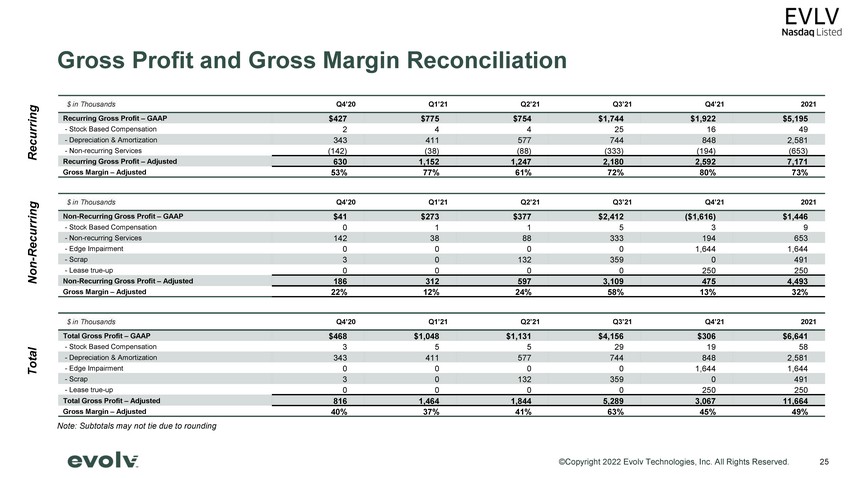
©Copyright 2022 Evolv Technologies, Inc. All Rights Reserved. 25 $ in Thousands Q4’20 Q1’21 Q2’21 Q3’21 Q4’21 2021 Recurring Gross Profit – GAAP $427 $775 $754 $1,744 $1,922 $5,195 - Stock Based Compensation 2 4 4 25 16 49 - Depreciation & Amortization 343 411 577 744 848 2,581 - Non - recurring Services (142) (38) (88) (333) (194) (653) Recurring Gross Profit – Adjusted 630 1,152 1,247 2,180 2,592 7,171 Gross Margin – Adjusted 53% 77% 61% 72% 80% 73% $ in Thousands Q4’20 Q1’21 Q2’21 Q3’21 Q4’21 2021 Non - Recurring Gross Profit – GAAP $41 $273 $377 $2,412 ($1,616) $1,446 - Stock Based Compensation 0 1 1 5 3 9 - Non - recurring Services 142 38 88 333 194 653 - Edge Impairment 0 0 0 0 1,644 1,644 - Scrap 3 0 132 359 0 491 - Lease true - up 0 0 0 0 250 250 Non - Recurring Gross Profit – Adjusted 186 312 597 3,109 475 4,493 Gross Margin – Adjusted 22% 12% 24% 58% 13% 32% $ in Thousands Q4’20 Q1’21 Q2’21 Q3’21 Q4’21 2021 Total Gross Profit – GAAP $468 $1,048 $1,131 $4,156 $306 $6,641 - Stock Based Compensation 3 5 5 29 19 58 - Depreciation & Amortization 343 411 577 744 848 2,581 - Edge Impairment 0 0 0 0 1,644 1,644 - Scrap 3 0 132 359 0 491 - Lease true - up 0 0 0 0 250 250 Total Gross Profit – Adjusted 816 1,464 1,844 5,289 3,067 11,664 Gross Margin – Adjusted 40% 37% 41% 63% 45% 49% Recurring Non - Recurring Total Gross Profit and Gross Margin Reconciliation Note: Subtotals may not tie due to rounding
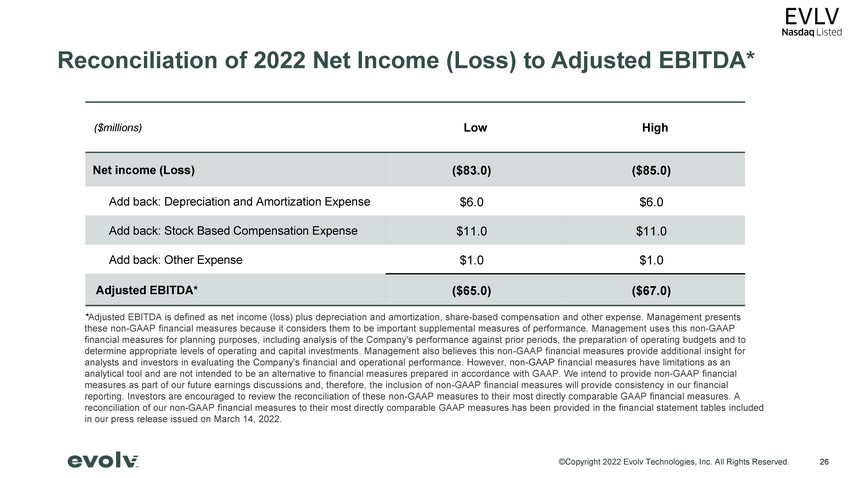
©Copyright 2022 Evolv Technologies, Inc. All Rights Reserved. 26 Reconciliation of 2022 Net Income (Loss) to Adjusted EBITDA* * Adjusted EBITDA is defined as net income (loss) plus depreciation and amortization, share - based compensation and other expense. Management presents these non - GAAP financial measures because it considers them to be important supplemental measures of performance. Management use s this non - GAAP financial measures for planning purposes, including analysis of the Company's performance against prior periods, the preparat ion of operating budgets and to determine appropriate levels of operating and capital investments. Management also believes this non - GAAP financial measures pro vide additional insight for analysts and investors in evaluating the Company's financial and operational performance. However, non - GAAP financial measures h ave limitations as an analytical tool and are not intended to be an alternative to financial measures prepared in accordance with GAAP. We intend t o p rovide n on - GAAP financial measures as part of our future earnings discussions and, therefore, the inclusion of non - GAAP financial measures will provide co nsistency in our financial reporting. Investors are encouraged to review the reconciliation of these non - GAAP measures to their most directly comparable GA AP financial measures. A reconciliation of our non - GAAP financial measures to their most directly comparable GAAP measures has been provided in the finan cial statement tables included in our press release issued on March 14, 2022. ($millions) Low High Net income (Loss) ($83.0) ($85.0) Add back: Depreciation and Amortization Expense $6.0 $6.0 Add back: Stock Based Compensation Expense $11.0 $11.0 Add back: Other Expense $1.0 $1.0 Adjusted EBITDA* ($65.0) ($67.0)
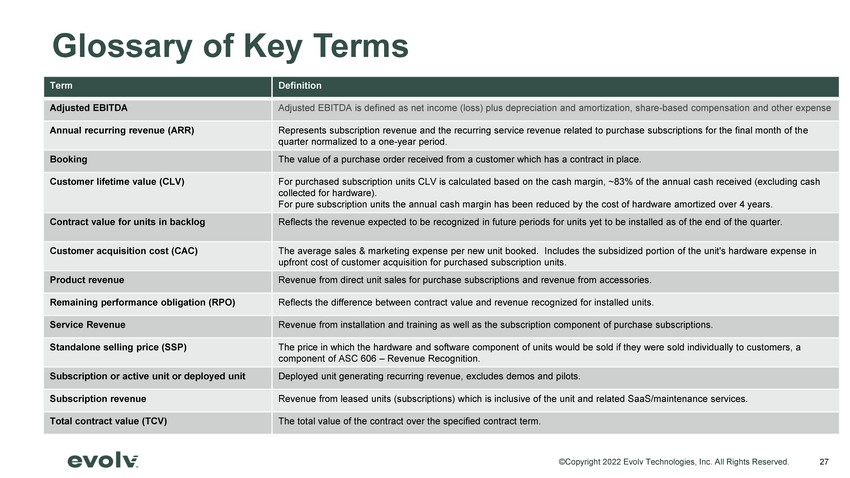
©Copyright 2022 Evolv Technologies, Inc. All Rights Reserved. Glossary of Key Terms 27 Term Definition Adjusted EBITDA Adjusted EBITDA is defined as net income (loss) plus depreciation and amortization, share - based compensation and other expense Annual recurring revenue (ARR) Represents subscription revenue and the recurring service revenue related to purchase subscriptions for the final month of th e quarter normalized to a one - year period. Booking The value of a purchase order received from a customer which has a contract in place. Customer lifetime value (CLV) For purchased subscription units CLV is calculated based on the cash margin, ~83% of the annual cash received (excluding cash collected for hardware). For pure subscription units the annual cash margin has been reduced by the cost of hardware amortized over 4 years. Contract value for units in backlog Reflects the revenue expected to be recognized in future periods for units yet to be installed as of the end of the quarter. Customer acquisition cost (CAC) The average sales & marketing expense per new unit booked. Includes the subsidized portion of the unit's hardware expense in upfront cost of customer acquisition for purchased subscription units. Product revenue Revenue from direct unit sales for purchase subscriptions and revenue from accessories. Remaining performance obligation (RPO) Reflects the difference between contract value and revenue recognized for installed units. Service Revenue Revenue from installation and training as well as the subscription component of purchase subscriptions. Standalone selling price (SSP) The price in which the hardware and software component of units would be sold if they were sold individually to customers, a component of ASC 606 – Revenue Recognition. Subscription or active unit or deployed unit Deployed unit generating recurring revenue, excludes demos and pilots. Subscription revenue Revenue from leased units (subscriptions) which is inclusive of the unit and related SaaS/maintenance services. Total contract value (TCV) The total value of the contract over the specified contract term. 27

©Copyright 2022 Evolv Technologies, Inc. All Rights Reserved.